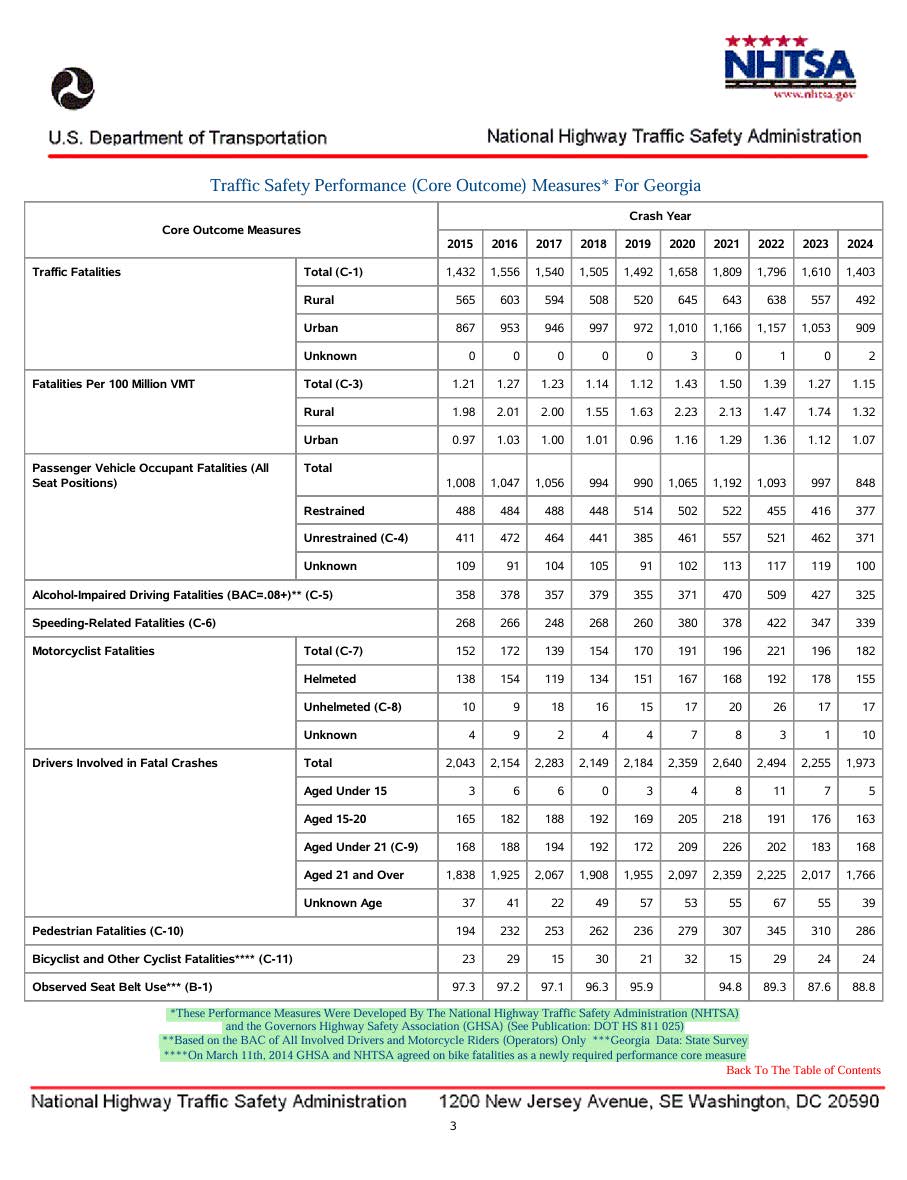
GOVERNOR'S OFFICE OF HIGHWAY SAFETY IN GEORGIA
CONTACT PHONE (404) 656 6996
OPEN HOURS

Mon-Fri 8am - 5pm

ADDRESS

7 M.L.K. Jr Dr SE #643, Atlanta, GA 30334

Traffic Data

The following 2021 data is as reported by the National Highway Traffic Safety Administration’s (NHTSA) Fatality Analysis Reporting System (FARS). This FARS data for the state of Georgia can be viewed in its entirety online by clicking HERE. Once on the page, click on Georgia in the map. Data can be viewed statewide or by county (by clicking on the drop down menu at the top of the page). Further county-related, interactive data maps for all of Georgia are also available at the above link.


Traffic Safety Performance (Core Outcome) Measures* For Georgia

Core Outcome Measures Year
2012 2013 2014 2015 2016 2017 2018 2019 2020 2021
Traffic Fatalities Total (C-1) 1,192 1,180 1,164 1,432 1,556 1,540 1,505 1,492 1,658 1,797
Rural 589 557 462 565 603 594 508 520 645 598
Urban 603 621 702 867 953 946 997 972 1,010 1,199
Unknown 0 2 0 0 0 0 0 0 3 0
Fatalities Per 100 Million Vehicle Miles Driven Total (C-3) 1.11 1.08 1.04 1.21 1.27 1.23 1.14 1.12 1.43 1.49
Rural 1.68 2.18 1.79 1.98 2.01 2.00 1.55 1.63 2.23 1.98
Urban 0.83 0.74 0.82 0.97 1.03 1.00 1.01 0.96 1.16 1.33
Passenger Vehicle Occupant Fatalities
(All Seat Positions)
Total 829 812 795 1,008 1,047 1,056 994 990 1,065 1,182
Restrained 394 350 376 488 484 488 448 514 502 515
Unrestrained (C-4) 368 377 363 411 472 464 441 385 461 555
Unknown 67 85 56 109 91 104 105 91 102 112
Alcohol-Impaired Driving Fatalities (BAC=.08+)** (C-5) 295 296 279 358 378 357 379 355 373 391
Speeding-Related Fatalities (C-6) 180 197 213 268 266 248 268 260 380 369
Motorcyclist Fatalities Total (C-7) 134 116 137 152 172 139 154 170 186 185
Helmeted 125 107 124 138 154 119 134 151 166 165
Unhelmeted (C-8) 8 5 8 10 9 18 16 15 14 14
Unknown 1 4 5 4 9 2 4 4 6 6
Drivers Involved in Fatal Crashes Total 1,676 1,621 1,622 2,043 2,154 2,283 2,149 2,184 2,359 2,617
Aged Under 15 4 0 4 3 6 6 0 3 4 8
Aged 15-20 154 156 145 165 182 188 192 169 205 215
Aged Under 21 (C-9) 158 156 149 168 188 194 192 172 209 223
Aged 21 and Over 1,499 1,442 1,448 1,838 1,925 2,067 1,908 1,955 2,097 2,345
Unknown Age 19 23 25 37 41 22 49 57 53 49
Pedestrian Fatalities (C-10) 167 176 163 194 232 253 262 236 279 306
Bicyclist and Other Cyclist Fatalities**** (C-11) 17 28 19 23 29 15 30 21 32 15
Observed Seat Belt Use*** (B-1) 92.0 95.5 97.3 97.3 97.2 97.1 96.3 95.9 94.8


Fatality Rates: Georgia , U.S. and Best State

Year Fatalities Total Vehicle Miles
Traveled (Millions)
Fatalities Per 100 Million
Vehicle Miles Traveled
Total Population Fatalities Per 100,000
Population
2017 Georgia 1,540 124,733 1.23 10,417,031 14.78
US 37,473 3,210,248 1.17 325,122,128 11.53
Best State* 0.55 4.45
2018 Georgia 1,505 131,456 1.14 10,519,389 14.31
US 36,835 3,240,327 1.14 326,838,199 11.27
Best State* 0.53 4.40
2019 Georgia 1,492 133,128 1.12 10,628,020 14.04
US 36,355 3,261,772 1.11 328,329,953 11.07
Best State* 0.52 3.25
2020 Georgia 1,658 115,967 1.43 10,725,800 15.46
US 39,007 2,903,622 1.34 331,501,080 11.77
Best State* 0.63 4.88
2021 Georgia 1,797 120,685 1.49 10,799,566 16.64
US 42,939 3,140,088 1.37 331,893,745 12.94
Best State* 0.71 5.75


Alcohol-Impaired Driving Fatalities**:
Georgia , U.S. and Best State

Year Total Fatalities
in all Crashes
Alcohol-Impaired Driving Fatalities (BAC
= .08+)
Number Percent Per 100 Million
VMT
2017 Georgia 1,540 357 23 0.29
US 37,473 10,880 29 0.34
Best State* 19 0.14
2018 Georgia 1,505 379 25 0.29
US 36,835 10,710 29 0.33
Best State* 19 0.16
2019 Georgia 1,492 355 24 0.27
US 36,355 10,196 28 0.31
Best State* 15 0.12
2020 Georgia 1,658 373 22 0.32
US 39,007 11,718 30 0.40
Best State* 20 0.18
2021 Georgia 1,797 391 22 0.32
US 42,939 13,384 31 0.43
Best State* 20 0.23


Fatalities
per 100 Million VMT


Alcohol-Impaired Driving Fatalities
per 100 Million VMT


Blood Alcohol Concentration (BAC) Reporting Rates
For Drivers/Motorcycle Rider (Operators)
Involved in Fatal Crashes:
Georgia, U.S. and Best State

Year Surviving Drivers/Motorcycle Rider Killed Drivers/Motorcycle Rider Total Drivers/Motorcycle Rider
Total With Blood Alcohol Concentration
(BAC) Results Reported to FARS
Total With Blood Alcohol Concentration
(BAC) Results Reported to FARS
Total With Blood Alcohol Concentration
(BAC) Results Reported to FARS
Number Percent Number Percent Number Percent
2017 Georgia 1,276 245 19 1,007 553 55 2,283 798 35
US 28,995 7,329 25 23,757 17,001 72 52,752 24,330 46
Best State* 93 94 89
2018 Georgia 1,197 247 21 952 513 54 2,149 760 35
US 28,860 7,161 25 23,045 15,921 69 51,905 23,082 44
Best State* 80 93 83
2019 Georgia 1,219 242 20 965 482 50 2,184 724 33
US 28,555 6,914 24 22,747 15,446 68 51,302 22,360 44
Best State* 86 93 82
2020 Georgia 1,310 230 18 1,049 487 46 2,359 717 30
US 29,305 6,809 23 24,860 15,711 63 54,165 22,520 42
Best State* 86 98 88
2021 Georgia 1,442 230 16 1,175 525 45 2,617 755 29
US 33,482 6,908 21 27,422 16,147 59 60,904 23,055 38
Best State* 84 93 81


Daytime Front Seat (Outboard Only) Passenger Vehicle Occupants, Aged 5 and Over, by Restraint Use:
Fatalities and Observed
Georgia, U.S. and Best State

Year Fatalities – Restrained** Observed – Restrained***
Percent Percent
2017 Georgia 61 97.1
US 61 89.7
Best State* 100 97.1
2018 Georgia 59 96.3
US 62 89.6
Best State* 100 97.8
2019 Georgia 66 95.9
US 62 90.7
Best State* 80 97.1
2020 Georgia 63
US 57 90.3
Best State* 72 95.7
2021 Georgia 56 94.8
US 58 90.4
Best State* 80 97.2


Daytime Front Seat (Outboard Only)
Passenger Vehicle Occupant Fatalities
Aged 5 and over, by Percent Restraint Use*


Daytime Front Seat (Outboard Only)
Passenger Vehicle Occupants Observed
Aged 5 and Over, by Percent Restraint Use**

Georgia Passenger Vehicle Occupant Fatalities Age 5 and Above
by Restraint Use and Lives Saved Estimates
Year Fatalities Age 5 and Above* Lives Saved Estimates**
Total Restrained Unrestrained Unknown Restraint
Use
Percent Known Restrained* Lives Saved at Current
Belt Use
Potential Additional
Lives Savable at
100% Usage
2017 1,044 476 464 104 51 648 34
2018 979 438 436 105 50
2019 977 505 382 90 57
2020 1,030 484 445 101 52
2021 1,160 503 550 107 48


Georgia Passenger Vehicle Occupant Fatalities Age 4 and Under
by Restraint Use and Lives Saved Estimates

Year Fatalities Age 4 and Under* Lives Saved Estimates**
Total Restrained Unrestrained Unknown Restraint
Use
Percent Known Restrained* Lives Saved at Current
Seat Belt and Child
Safety Seat Usage
2017 12 12 0 0 100 16
2018 15 10 5 0 67
2019 13 9 3 1 75
2020 17 11 5 1 69
2021 12 8 3 1 73


Georgia Motorcyclist Fatalities
by Helmet Use and Lives Saved Estimates
Year Fatalities Lives Saved Estimates**
Total Helmeted Unhelmeted Unknown Helmet Use Percent Known Helmeted* Lives Saved at Current
Helmet Use
Additional Lives
Savable at 100% Helmet
Usage
2017 139 119 18 2 87 72 6
2018 154 134 16 4 89
2019 170 151 15 4 91
2020 186 166 14 6 92
2021 185 165 14 6 92


Georgia Fatalities by Person Type
Person Type 2017 2018 2019 2020 2021
Number Percent* Number Percent* Number Percent* Number Percent* Number Percent*
Occupants Passenger Car 557 36 541 36 550 37 558 34 613 34
Light Truck – Pickup 234 15 215 14 190 13 227 14 238 13
Light Truck – Utility 217 14 193 13 194 13 252 15 285 16
Light Truck – Van 46 3 44 3 54 4 28 2 46 3
Light Truck – Other 2 0 1 0 2 0 0 0 0 0
Large Truck 46 3 34 2 31 2 38 2 42 2
Bus 3 0 1 0 1 0 0 0 0 0
Other/Unknown Occupants 22 1 25 2 28 2 57 3 53 3
Total Occupants 1,127 73 1,054 70 1,050 70 1,160 70 1,277 71
Motorcyclists Total Motorcyclists 139 9 154 10 170 11 186 11 185 10
Nonoccupants Pedestrian 253 16 262 17 236 16 279 17 306 17
Bicyclist and Other Cyclist 15 1 30 2 21 1 32 2 15 1
Other/Unknown Nonoccupants 6 0 5 0 15 1 1 0 14 1
Total Nonoccupants 274 18 297 20 272 18 312 19 335 19
Total Total 1,540 100 1,505 100 1,492 100 1,658 100 1,797 100


Georgia Fatalities by Crash Type
Crash Type 2017 2018 2019 2020 2021
Total Fatalities (All Crashes)* 1,540 1,505 1,492 1,658 1,797
– (1) Single Vehicle 823 836 751 863 942
– (2) Involving a Large Truck 228 192 204 235 244
– (3) Involving Speeding 248 268 260 380 369
– (4) Involving a Rollover 362 319 314 415 428
– (5) Involving a Roadway Departure 770 765 706 827 932
– (6) Involving an Intersection (or Intersection Related) 402 334 394 370 381


Georgia Motorcyclist Fatalities by Age
Year Age Total
<20 20-29 30-39 40-49 50-59 >59
2017 9 41 22 22 26 19 139
2018 6 44 31 24 28 21 154
2019 7 42 37 27 31 26 170
2020 9 43 44 39 34 17 186
2021 10 39 47 42 25 22 185


Georgia Motorcyclist Fatalities Per 100,000 Registered Motorcycles
Year Motorcyclist Fatalities Total Motorcycle
Registrations*
Motorcyclist
Fatalities
Per 100,000
Motorcycle
Registrations
2017 139 203,922 68.16
2018 154 203,968 75.50
2019 170 203,985 83.34
2020 186 207,657 89.57
2021 185 213,096 86.82


Georgia Fatalities by Person Type and Race/Hispanic Origin1
Person Type by Race/Hispanic Origin1 2017 2018 2019 2020
Occupants (All Vehicle Types) Hispanic 63 72 72 85
White Non-Hispanic 678 609 597 716
Black, Non-Hispanic 382 363 372 464
American Indian, Non-Hispanic/Unknown 1 1 1 2
Asian, Non-Hispanic/Unknown 11 19 17 12
Pacific Islander, Non-Hispanic/Unknown 0 0 1 0
Multiple Races, Non-Hispanic/Unknown 0 1 1 2
All Other Non-Hispanic or Race 6 6 6 8
Unknown Race and Unknown Hispanic 125 137 153 57
Total 1,266 1,208 1,220 1,346
Non-Occupants
(Pedestrians, Pedalcyclists and
Other/Unknown NonOccupants)
Hispanic 22 23 19 23
White Non-Hispanic 113 125 84 123
Black, Non-Hispanic 105 121 132 131
American Indian, Non-Hispanic/Unknown 0 1 0 1
Asian, Non-Hispanic/Unknown 3 4 1 7
Multiple Races, Non-Hispanic/Unknown 0 0 0 2
All Other Non-Hispanic or Race 2 0 2 1
Unknown Race and Unknown Hispanic 29 23 34 24
Total 274 297 272 312
Total Hispanic 85 95 91 108
White Non-Hispanic 791 734 681 839
Black, Non-Hispanic 487 484 504 595
American Indian, Non-Hispanic/Unknown 1 2 1 3
Asian, Non-Hispanic/Unknown 14 23 18 19
Pacific Islander, Non-Hispanic/Unknown 0 0 1 0
Multiple Races, Non-Hispanic/Unknown 0 1 1 4
All Other Non-Hispanic or Race 8 6 8 9
Unknown Race and Unknown Hispanic 154 160 187 81
Total 1,540 1,505 1,492 1,658


5 Year Trend For The Top 10 Counties of 2020 – Fatalities
Georgia Counties by 2021 Ranking Fatalities Percent of Total
2017 2018 2019 2020 2021 2017 2018 2019 2020 2021
1 Fulton County 115 131 144 145 154 7 9 10 9 9
2 Dekalb County 95 108 79 91 145 6 7 5 5 8
3 Clayton County 32 45 51 49 66 2 3 3 3 4
4 Cobb County 53 57 67 84 64 3 4 4 5 4
5 Gwinnett County 66 62 61 57 49 4 4 4 3 3
6 Bibb County 34 33 35 33 47 2 2 2 2 3
7 Richmond County 32 23 26 30 44 2 2 2 2 2
8 Chatham County 29 37 30 34 41 2 2 2 2 2
9 Henry County 27 24 23 28 33 2 2 2 2 2
10 Bartow County 17 27 21 28 32 1 2 1 2 2
Sub Total 1.* Top Ten Counties 519 548 541 585 675 34 36 36 35 38
Sub Total 2.** All Other Counties 1,021 957 951 1,073 1,122 66 64 64 65 62
Total All Counties 1,540 1,505 1,492 1,658 1,797 100 100 100 100 100


5 Year Trend For The Top 10 Counties of 2020 – Fatalities Year to Year Percent Change
Georgia Counties by 2021 Ranking Fatalities Percent Change From Previous Year
2017 2018 2019 2020 2021 2018 2019 2020 2021
1 Fulton County 115 131 144 145 154 14 10 1 6
2 Dekalb County 95 108 79 91 145 14 -27 15 59
3 Clayton County 32 45 51 49 66 41 13 -4 35
4 Cobb County 53 57 67 84 64 8 18 25 -24
5 Gwinnett County 66 62 61 57 49 -6 -2 -7 -14
6 Bibb County 34 33 35 33 47 -3 6 -6 42
7 Richmond County 32 23 26 30 44 -28 13 15 47
8 Chatham County 29 37 30 34 41 28 -19 13 21
9 Henry County 27 24 23 28 33 -11 -4 22 18
10 Bartow County 17 27 21 28 32 59 -22 33 14
Sub Total 1.* Top Ten Counties 519 548 541 585 675 6 -1 8 15
Sub Total 2.** All Other Counties 1,021 957 951 1,073 1,122 -6 -1 13 5
Total All Counties 1,540 1,505 1,492 1,658 1,797 -2 -1 11 8


5 Year Trend For The Top 10 Counties of 2020 – Fatality Rates
Median Rate for all U.S. Counties: 17.68
Georgia Counties by 2021 Ranking Fatalities Per 100,000 Population
2017 2018 2019 2020 2021
1 Taliaferro County 62.03 310.56 64.56 192.68 256.74
2 Clinch County 45.06 30.30 15.07 14.87 89.22
3 Twiggs County 72.57 36.68 12.25 37.57 89.10
4 Oglethorpe County 0.00 6.65 13.14 26.91 79.26
5 Baker County 63.33 0.00 65.64 105.49 70.95
6 Clay County 0.00 68.94 0.00 35.27 69.40
7 Lincoln County 0.00 25.23 12.55 64.90 64.52
8 Worth County 48.70 24.62 44.59 33.79 63.25
9 Franklin County 34.97 30.38 60.03 42.68 63.06
10 Stewart County 31.60 15.54 0.00 56.66 56.17
Sub Rate 1.* Top Ten Counties 61.44 69.14 60.55 76.50 73.09
Sub Rate 2.** All Other Counties 14.39 13.82 13.65 15.04 16.14
Total Rate All Counties 14.78 14.31 14.04 15.46 16.64